
Tissue images and MS data were provided courtesy of Jessica Moore, and Jeff Spraggins, Mass Spectrometry Research Center, Department of Chemistry, Vanderbilt University School of Medicine, Nashville, TN, USA.
Application & Background
MALDI mass spectrometry imaging (MSI) is a powerful technology that allows the detection of analytes from tissue while preserving their spatial distribution. MALDI MSI of intact proteins is of great relevance for biomedical research, since it provides spatial information of endogenous proteins, as well as their post-translational modifications. However, intact protein imaging faces a number of inherent challenges related to throughput, the sensitivity at high spatial resolution, rates of image acquisition, and molecular specificity and identification. Next-generation platforms such as ultra-high speed MALDI-TOF and high mass resolution MALDI FTICR mass spectrometers can override such limitations, improving protein acquisition rates by ten-fold, achieving 10 µm spatial resolution with high sensitivity, and resolving protein isotopes up to ~20 KDa.
In this application note, two clinically-relevant case studies are presented as examples of the use of two different types of MALDI MSI, ultra-high speed MALDI-TOF MSI and MALDI FTICR MSI, for proteomic analyses. The first is in imaging protein expression in human lung tissue of a patient with cystic fibrosis. Cystic fibrosis (CF) is inherited in an autosomal recessive manner and is caused by the presence of mutations in both copies of the gene for the cystic fibrosis transmembrane conductance regulator (CFTR) protein, which is involved in homeostasis of sodium channels in the epithelium. Patients with CF present with difficulty breathing due to the blockage of airways by thick mucus, as well as bacterial colonization of the lungs (1, 2). High-speed MALDI-TOF MSI is an ideal tool by which to study the pathogenesis of CF, since the lung tissue from CF patients present with high heterogeneity and numerous biologically-relevant substructures.
The second was imaging protein expression in human clear cell renal cell carcinoma (ccRCC). Cancer diagnoses of the kidney have a ~23% mortality rate, with the vast majority being cases of ccRCC (3). Visual (by CT and MRI) and histological assessments of tumor margins have proven deficient at the time of surgical removal, leading to disease recurrence (4). For this reason, determining molecular localization patterns in and around the tumor would aid in the determination of its molecular margins (5).
Experimental
Sample Preparation

Figure 1. Spray parameters for MALDI matrix deposition.
10 µm cryosections were placed onto conductive ITO coated slides. Tissue was then washed with 70% EtOH for 30 sec, 100% EtOH for 30 sec, Carnoy fluid (6:3:1 EtOH: chloroform: acetic acid) for 2 min, 100% EtOH for 30 sec, H2O with 0.2% TFA for 30 sec, and 100% EtOH for 30 sec, and stored at -80°C until MSI analysis. Sections were coated with DHA (15 mg/mL) in 9:1 ACN:H2O using an HTX TM-Sprayer as described in Table 1.
MALDI Mass spectrometry imaging
Images of the human lung were collected with a single-spot laser setting of ~5 µm and a pixel scan size of 30 µm or 10 µm in both x and y axis, over a mass range of m/z 2,000 to 20,000 on a Bruker rapiFleX MALDI mass spectrometer.
Images of the human kidney were collected with a small laser setting of ~50 µm and a pixel spacing of 100 µm in both x and y axis, over a mass range of m/z 1,100 to 25,000 on a Bruker SolariX 15T FTICR mass spectrometer. For high m/z analysis, special tuning was required: Funnel RF amplitude (250 Vpp), accumulation hexapole (1.4 MHz, 1950 Vpp), transfer optics (1 MHz, 380 Vpp), time of flight delay (2.8 ms) and ICR cell (sweep excitation power 48%).
Results
Figure 1A shows a representative image from human lung tissue from a CF patient. Selected protein ion images collected with ultra-high speed MALDI-TOF MSI are shown in Fig. 1B-D.
Hemoglobin was detected throughout the tissue while histone H4 and S100A8 (a subunit of calprotectin) were found in abundance in the infected airways. The neutrophil antibacterial peptide, defensin 1, co-localized with the former. Calcyclin usually localizes in cells under mechanical strain. The high spatial resolution (10 µm) MALD-TOF IMS data presented in Figure 2 displays the great spatial heterogeneity of the sample.
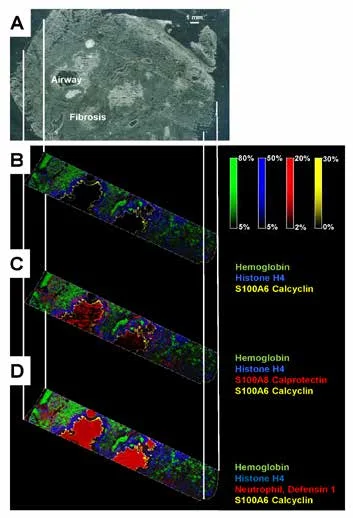
Figure 1. (A) Image of CF human lung with trichome staining prior to IMS acquisition. CF human lung at 30 µM using the RapifleX MALDI Tissuetyper, on linear positive ion mode. (B) Overlay: m/z 15,125.74 (hemoglobin, green), m/z 11,305.05 (histone H4, blue), m/z 10,095.5 (calcyclin, yellow). (C) Overlay: m/z 15,125.74 (hemoglobin, green), m/z 11,305.05 (histone H4, blue), m/z 10834.93 (S100A8, red), m/z 10,095.5 (calcyclin, yellow). (D) Overlay: m/z 15,125.74 (hemoglobin, green), m/z 11,305.05 (histone H4, blue), m/z 3450 (neuthrophil defensing 1, red), m/z 10,095.5 (calcyclin, yellow). Pixels are beam scanned with a 30 x 30 pixel. 141,000 pixels were acquired in about 1.5 hrs. Scale bar 1mm.
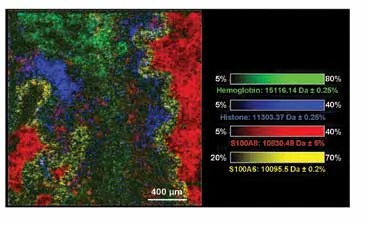
Figure 2. High-spatial resolution (10 µm) MALDI-TOF IMS data of CF human lung, using the Bruker rapifleX MALDI Tissuetyper, in linear positive ion mode. Overlay: m/z 15,125.74 (hemoglobin, green), m/z 11,305.05 (histone H4, blue), m/z 10834.93 (S100A8, red), m/z 10,095.5 (calcyclin, yellow). Pixels are beam scanned with a 30 x 30 pixel (140,775 pixel size).
MALDI FTICR MSI data obtained from human ccRCC tissue is shown in Figure 3. Note the localization of hemoglobin is the highest close to the tumor regions, a direct reflection of significant carcinogenic angiogenesis taking place. Histone H4 was observed to co-localize with calcyclin (S100A6).
Lastly, a unique feature of MALDI FTICR MSI for protein imaging is the capability to identify the various charge states of highly charged ions. In a recent work from the Caprioli group, the application of this technology allowed for the collection of ion images and isotopic distributions for the [M+H]1+ - 6+ charge states of the betasubunit of hemoglobin in human ccRCC (6).

Figure 3. A) Trichrome staining of a clear cell renal cell carcinoma human sample. (B) and (C) show MALDI FTICR protein imaging data collected with a 15T FTICR Bruker SolariX, on positive ion mode, at 100 µm spatial resolution. Overlay for (B): m/z 5654.472 (histone H4 with an acetylation and demethylation, blue), m/z 4312.809 (turquoise), m/z 2400.582 (red), m/z 7933.941 (hemoglobin subunit, green). Overlay for (C): m/z 5654.472 (histone H4 with an acetylation and demethylation, blue), m/z 10097.28 (orange), m/z 2400.582 (red), m/z 7933.941 (hemoglobin subunit, green), m/z 4312.809 (pink). Acquisition time ~1.5 sec/pixel, total ~6 hrs.
CONCLUSIONS
Ultra-high speed MALDI-TOF MSI and high-resolution MALDI FTICR MSI are the next-generation technologies for molecular histology. Ultra-high speed MALDI-TOF MSI provides with high spatial resolution, while MALDI FTICR MSI excels at molecular specificity for protein imaging.
References
(1) O’Sullivan, B. P., Freedman, S. D., Cystic fibrosis. Lancet 2009, 373, 1891–1904.
(2) Rowe, S. M., Miller, S., Sorscher, E. J., Cystic fibrosis. N. Engl. J. Med. 2005, 352, 1992–2001
(3) Siegel, R. L., Miller, K. D., Jemal, A., Cancer statistics, 2015. Cancer J. Clin. 2015, 65, 5–29
(4) Chow, W. H., Dong, L. M., Devesa, S. S., Epidemiology and risk factors for kidney cancer. Nature Reviews Urology 2010, 7, 245–257
(5) Oppenheimer, S. R., Mi, D., Sanders, M. E., Caprioli, R. M., Molecular analysis of tumor margins by MALDI mass spectrometry in renal carcinoma. J. Proteome Res. 2010, 9, 2182– 2190
(6) Spraggins, J. M., Rizzo, D. G., Moore, J. L., Noto, M. J., Skaar, E. P., Caprioli, R. M., Next-generation technologies for spatial proteomics: integrating ultra-high speed MALDI-TOF and high mass resolution MALDI FTICR imaging mass spectrometry for protein analysis. Proteomics 2016, 16, 1678-1689