
Application & Background
The methods of cheese-making and ripening are complex and often likened more to an art than a science (1). However, as more has been discovered about the microbial communities and biochemical processes that produce the distinct flavor profiles and textures of various cheeses, cheesemongers and affineurs have been able to apply new analytical techniques to their cheese aging and quality control practices (1). Casein proteins are an important energy source for the microbial communities that drive the complex process of surface-ripening of various types of cheese (2). The process of proteolysis involves cleavage of these caseins into smaller peptides, then free amino acids, and culminates in amino acid catabolism, which is one of the primary biochemical reactions that produces flavor in cheese (2). Here, we aimed to use the SepQuant dropletProbe, an innovative liquid extraction surface analysis sampling system, coupled to high performance liquid chromatography-mass spectrometry (HPLC-MS) to profile the free amino acid content of 12 different cheeses.
Experimental
Sample Preparation
All cheese was purchased at Trader Joe’s and stored at 20°C until sectioning. Samples were taken from the 12 different cheeses using a razor blade and allowed to dry overnight at room temperature on the benchtop. Remaining liquid on the surface of the cheese was blotted off each sample individually using KimWipes. Samples were mounted onto glass slides using double-sided tape.

Figure 1. Overview of experimental workflow: (A) All cheese sections were sampled via the SeqQuant® dropletProbe, (B) the droplets were separated using an Agilent 1100 HPLC system with an in-line Waters PAH, C-18 column, (C) data were collected using an electrospray AB Sciex QTRAP® 5500, and (D) analyzed using MRM triggered MS/MS (data shown: MRM extracted chromatograms for proline (blue), valine (red), leucine (green), and phenyalanine (gray).
Surface Sampling using the SepQuant® dropletProbe
Surface sampling was performed using 1 μL droplets of H2O dispensed from a 100 μL syringe filled with 10 μL H2O using the SeqQuant® dropletProbeTM. Two extraction cycles were implemented at each sample location. Samples were set up to run in batches. Three quality photos were acquired for each sampling event to provide a quality control measure during the automated, unsupervised data acquisition (Figure 2).

Figure 2. Examples of quality control photos obtained for every sampling event by the SeqQuant® dropletProbe: (A) Before droplet disbursement, (B) during surface sampling, and (C) upon retraction of the droplet.
HPLC/MS-MS Analysis
The total volume in the syringe of 10 μL was injected into Agilent 1100 HPLC system with an in-line Waters PAH, C-18, 5 μm, 2x150 mm column. Analytes were isocratically separated using 100/0.1 (v/v) H2O/formic acid at a 200 μL/min flow rate for 10 minutes. Data were collected on an AB Sciex QTRAP® 5500 system using positive mode electrospray ionization. Optimized MRM transitions for the 17 amino acids were adopted from a prior publication.3 Total analysis time was 12 minutes for each sample. All data were natural log-transformed to conform to a near-normal distribution. Statistical tests, including analysis of variance (ANOVA) and two-sided t-tests were used to analyze the transformed data.
Results
Reproducibility of SepQuant dropletProbe Data
In order to assess reproducibility of the SepQuant® dropletProbeTM sampling technique, biological replicate samples (i.e. from the same region of the same cheese) were taken for multiple samples. Results from a single factor ANOVA indicated no significant difference (p-value = 0.99) between the means across any of the amino acids for these repeated samples (Figure 3).

Figure 3. The measured ln-transformed values of 17 amino acids across three replicate samples of the body of Comte cheese.
Levels of Amino Acids are Higher in the Body versus Rind Region of the Cheeses
Results from two-sided t-tests indicated that levels of six amino acids were present at significantly higher levels (p-value < 0.05) in areas of the body of cheeses versus therind. One amino acid, cystine was present in greater quantities in the rind versus the body of these cheeses. were used to compare the relative abundance of the 17 measured amino acids in the rind versus the body regions of the cheeses (Figure 4).

Figure 4. The measured averages of ln-transformed values of the 7 amino acids that were significantly different in the rind versus the body region of the cheeses.
Levels of Amino Acids Vary in Relation to Cheese Hardness
Using the classifications given on the cheese labels, cheeses were classified into four categories of (1) Hard, (2) Semi-Hard, (3) Semi-soft, and (4) Soft. One-way ANOVA tests were used to test for differences in the means of each of the 17 measured amino acids among these four groups. A Bonferroni correction was applied to the resulting p-values to account for multiple tests and 99% confidence intervals were calculated . Glycine, serine, and aspartic acid tended to be present at higher levels in harder cheeses (Figure 5).


Figure 5. Significant differences between cheeses grouped by hardness were detected for 3 of the 17 measured amino acids: glycine, serine, and aspartic acid. These three amino acids tended to be present at higher levels in harder cheeses.
Conclusions
The amino acid profile between and within different cheese samples varies considerably. In contrast to typical LC-MS sample preparation of sample homogenization, surface sampling via the SepQuant® dropletProbeTM allowed us to query different locations within a single sample to observe heterogeneity across the surface of various cheeses (Figure 7). In three of the samples, 2 locations representing different biological conditions were measured in separate sampling events (Figure 6). The SepQuant® dropletProbe also allowed for unsupervised, automated sampling of many cheese specimens with easy visualization of relative quantification of all 17 amino acids. In this study, we demonstrated that the SepQuant® dropletProbe sampling system is a sensitive, efficient, and non-destructive method to characterize the free amino acid content of many different types of cheese. Future research could aim to apply this same concept to a variety of different known flavor compounds in cheese and other foodstuffs and to monitor the production of flavor compounds from the same sample in situ over the course of time.
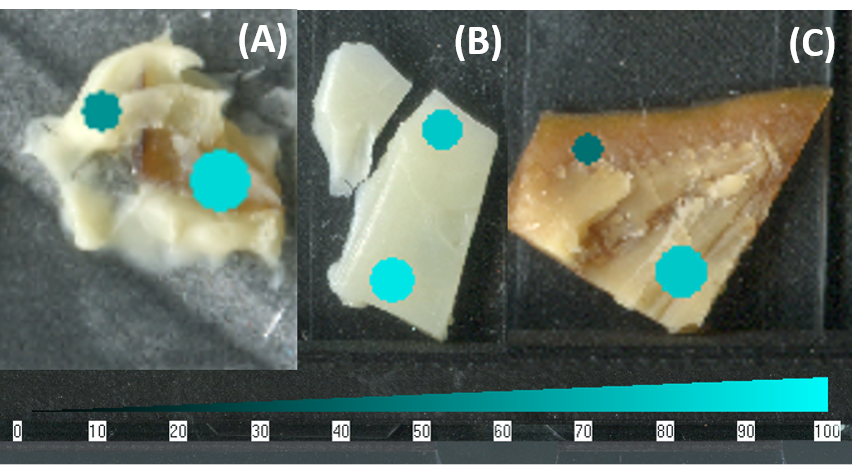
Figure 7. The SepQuant® dropletProbe software interface allowed for easy visualization of intrasample variability as it related to spatial features of the sample. (A) Proline was more abundant in the mushroom of the triple cream brie cheese with mushrooms than in the body of the cheese. (B) Valine was more abundant in the air-exposed hole of the Emmantal cheese than the inside. (C) Leucine was more in the inner rind than the outer rind of the gouda cheese.

Figure 7. The heatmap depiction of relative aspartic acid levels in different cheese samples. Aspartic acid has previously been indicated to be one of the amino acids that primarily composes casein proteins (1).
References
1) Johnson ME. A 100-Year Review: Cheese production and quality. J Dairy Sci. 2017;100(12):9952-9965. doi:10.3168/jds.2017-12979
2) Dugat-Bony E, Straub C, Teissandier A, et al. Overview of a surface-ripened cheese community functioning by meta-omics analyses. PLoS One. 2015;10(4):1-25. doi:10.1371/journal.pone.0124360
3) Lane CS. Rapid LC-MS/MS Analysis of Free Amino Acids in Extracellular Matrix. Biomarkers Omi. 2015;(RUO-MKT-02-3777-A):17-19.